Using Spatial Tree Maps in Local Authority Decision Making and Reporting
| Robert Radburn | Research and Information, Leicestershire County Council |
| Roger Beecham | Research and Information, Leicestershire County Council |
| Jason Dykes | giCentre, City University London |
| Jo Wood | giCentre, City University London |
| Aidan Slingsby | giCentre, City University London |
Published: October, 2010
 |  | Full article |
Summary of the Technique
At Leicestershire County Council we are using two new visualization solutions developed at the giCentre at City University London to inform local transport planning: OD maps and spatial treemaps - the former being a particular case of the latter.
Summary of its Impact
Spatial Treemaps in Leicestershire
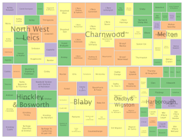
Large areas of sparsely populated countryside separate the market towns of Leicestershire. Consequently, at Leicestershire County Council (LCC), we are using spatial treemaps to analyse data sets and communicate trends both online and in reports. For example, "Delivering a Sustainable Transport System in Leicestershire" (DaSTS) is an evidence base that will inform Leicestershire's Local Transport Plan (LTP) for 2011-2016. Spatial treemaps, with nodes sized by population, use familiar districts to map three hierarchical geographies: ward, lower super output area (LSOA) and output area (OA). These graphics are used in the report to show the extent to which jobs are concentrated whilst workers are dispersed, and how this varies with scale and across the county.
|
Cluster analysis by ward - a typology based upon local commuting patterns:
|
|
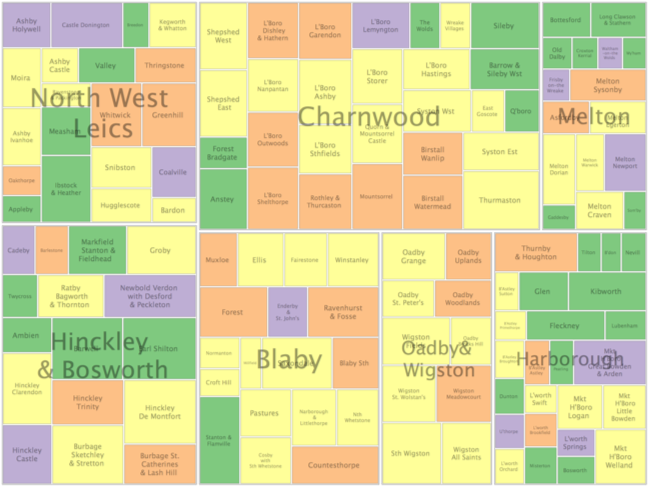
Mean distance travelled by car to LSOA of workplace by LSOA:
|
|
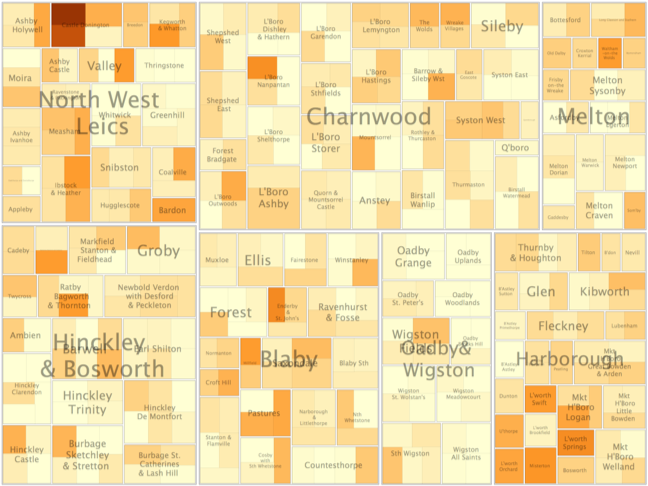
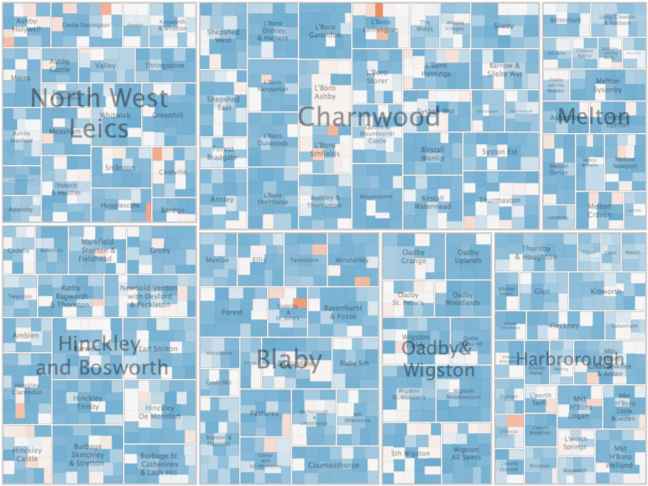
Ratio of jobs available to employed residents by OA:
Strength of colour relates to variation around a ratio of 1. A diverging ColorBrewer scheme is used in the spatial treemap framework. |
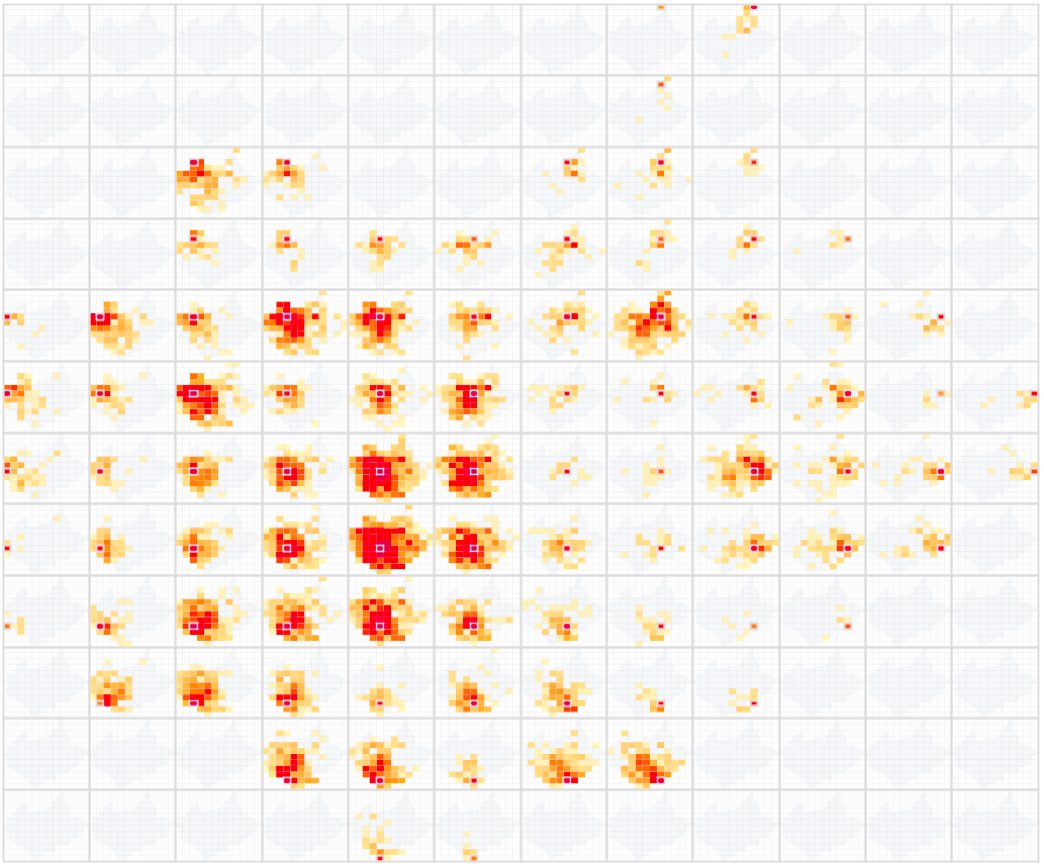
OD maps consist of spatially arranged small multiples. Each of these shows the distribution of origins for the destination represented by the position of the small multiple in the larger map. Leicestershire is divided into a 12*12 regular grid in this OD map used in the DaSTS report. It contains 144 spatially arranged mini-maps that reveal commuting patterns for each pair of cells. The OD map is a spatial representation of the standard OD matrix. Unlike the matrix it allows us to discover and communicate the spatial patterns so essential to our transport planning context.
|
| OD map of Leicestershire showing origins of commuters by destination using a linear sequential ColorBrewer scheme. |
Discoveries
- The complexity and uneven geography of labour market flows is apparent in the graphics.
- Previously undetected local employment centres can be (and have been) identified.
- Significant commutes to market towns are evident - these were hidden in our flow maps.
- A north-south (as opposed to east-west) bias in the case of long commutes was unknown.
These discoveries emphasize the need for coordinated and sustainable transport planning.
Reactions & Reflections ...
"These visualization techniques are providing us with solutions for showing the increasing amount of data that is being collected on travel movements to a wider audience - as well as helping us understand the data."
Paul Sheard, Group Manager, Transport Planning, Leicestershire County Council
"The spatial treemaps were a nice way of presenting the different labour market indicators."
"Although they took a bit of effort at first ... With the OD map, I felt I could genuinely get a sense of commuting patterns in Leicestershire."
Stephen Rothwell, Transport Planning, Leicestershire County Council
"The work has given local authority analysts access to methods with which to represent and communicate trends in large data sets. We could not present such details to our transport planners concurrently, geographically and at multiple scales using alternative approaches."
"These graphics demonstrate why a central research unit should work closely with other departments within an organisation to 'add value' to data to provide effective, appropriate and informed data analysis."
Robert Radburn, Research and Information, Leicestershire County Council
Using Spatial Treemaps and OD Maps
Both types of graphics feature thoughout the DaSTS report as Leicestershire is mapped according to these new geographies.
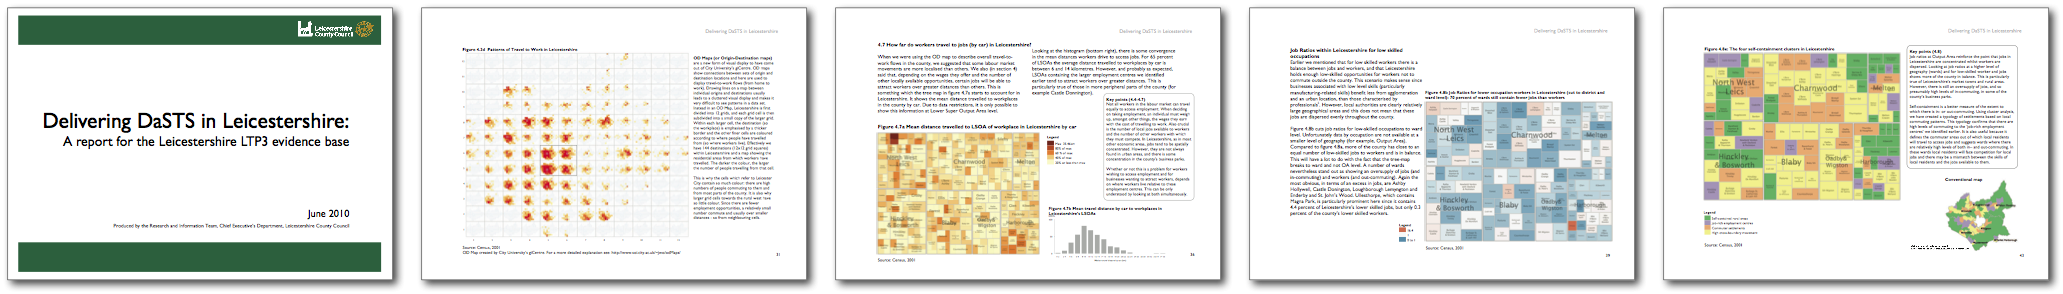
|
| Spatial tree maps and OD maps feature throughout the DaSTS report: see pages 31, 36, 39 and 43 reproduced here. |
The intention is to use the treemaps in the LTP.
As such they will contribute towards making labour markets more flexible - potentially increasing employment rates and boosting business competitiveness in Leicestershire following an economic recession.
These visualization methods have given local authority analysts access to means with which to represent and communicate complex trends in large data sets in a novel and effective manner in the context of a real and very important applications area.
Links
Copyright of article and images belongs to the author or his employer unless otherwise mentioned