Hierarchical Clustering Explorer

| Jinwook Seo | Seoul National University |
Published: October, 2009
 |  | Full article |
Summary of the Tool
HCE (Hierarchical Clustering Explorer) is a visualization tool for interactive exploration of multidimensional datasets. One of the goals of HCE is to help users explore and understand multidimensional datasets by maximizing the human perceptual skills that have been underutilized. HCE is a telescope with which users can systematically scrutinize multidimensional datasets in order to identify unexpected interesting features hidden in the multidimensional space.
Summary of its Impact
The authors provide three concrete examples of impact.
Analyzing Microarray Experiment Datasets
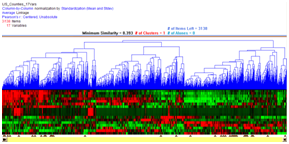
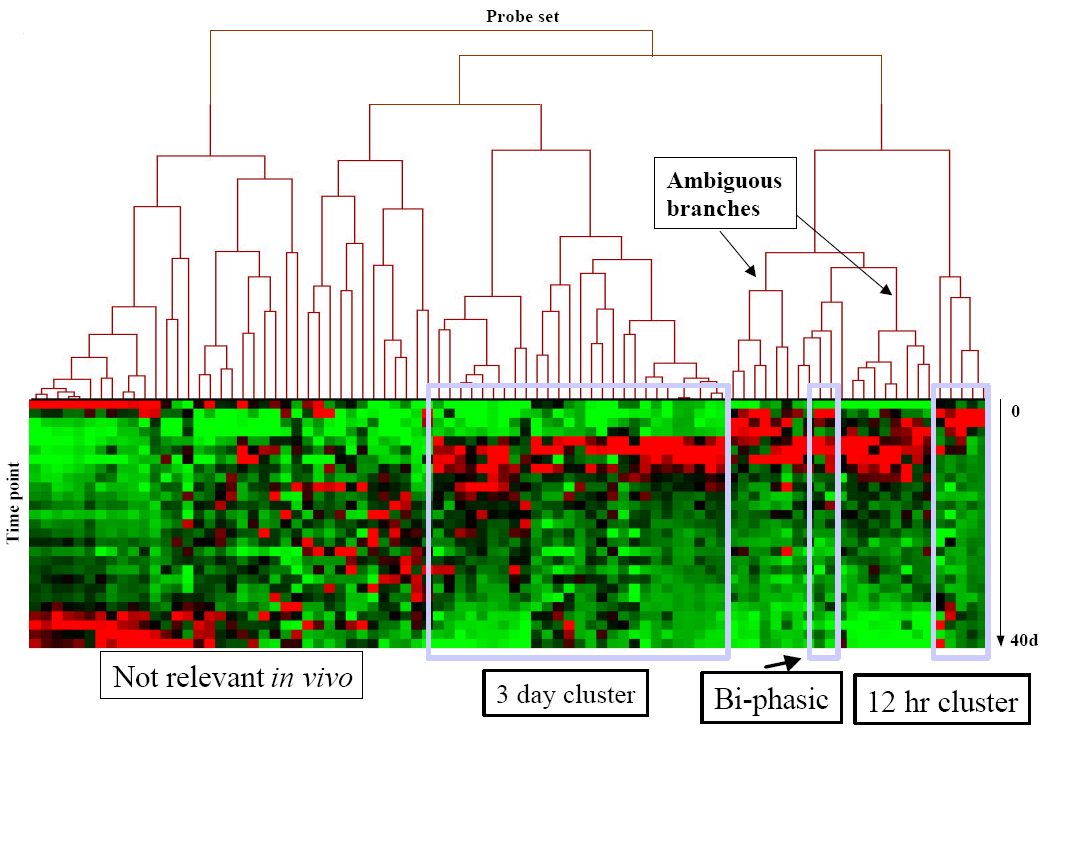
Since HCE was developed for microarray data analysis at the beginning, it is well-known to microarray researchers. There are quite a few biology journal papers that cited HCE as an analysis tool for their microarray data. The most prevalent usage pattern in this field is that users play with the minimum similarity bar (and detail cutoff bar for large datasets) until they see a meaningful separation of clusters. Then they identify clusters that deserve further investigations: the ones with focus genes or the ones with target genes selected by interactive search in other views such as the profile search view in HCE. Once they find such clusters, they often generate a hypothesis that genes in the cluster might have similar or related biological functions to the focus/target genes. Using this discovery process, a team of molecular biologists at the Children�s Research Institute could identify 18 genes involved in the muscle regeneration process. Among other clusters of importance, they mainly focused on the 3 day cluster where a focus gene (MyoD) belongs. Then they moved on to 12 hour clusters where other focus genes are.
 |
Learning the hierarchical agglomerative clustering algorithm
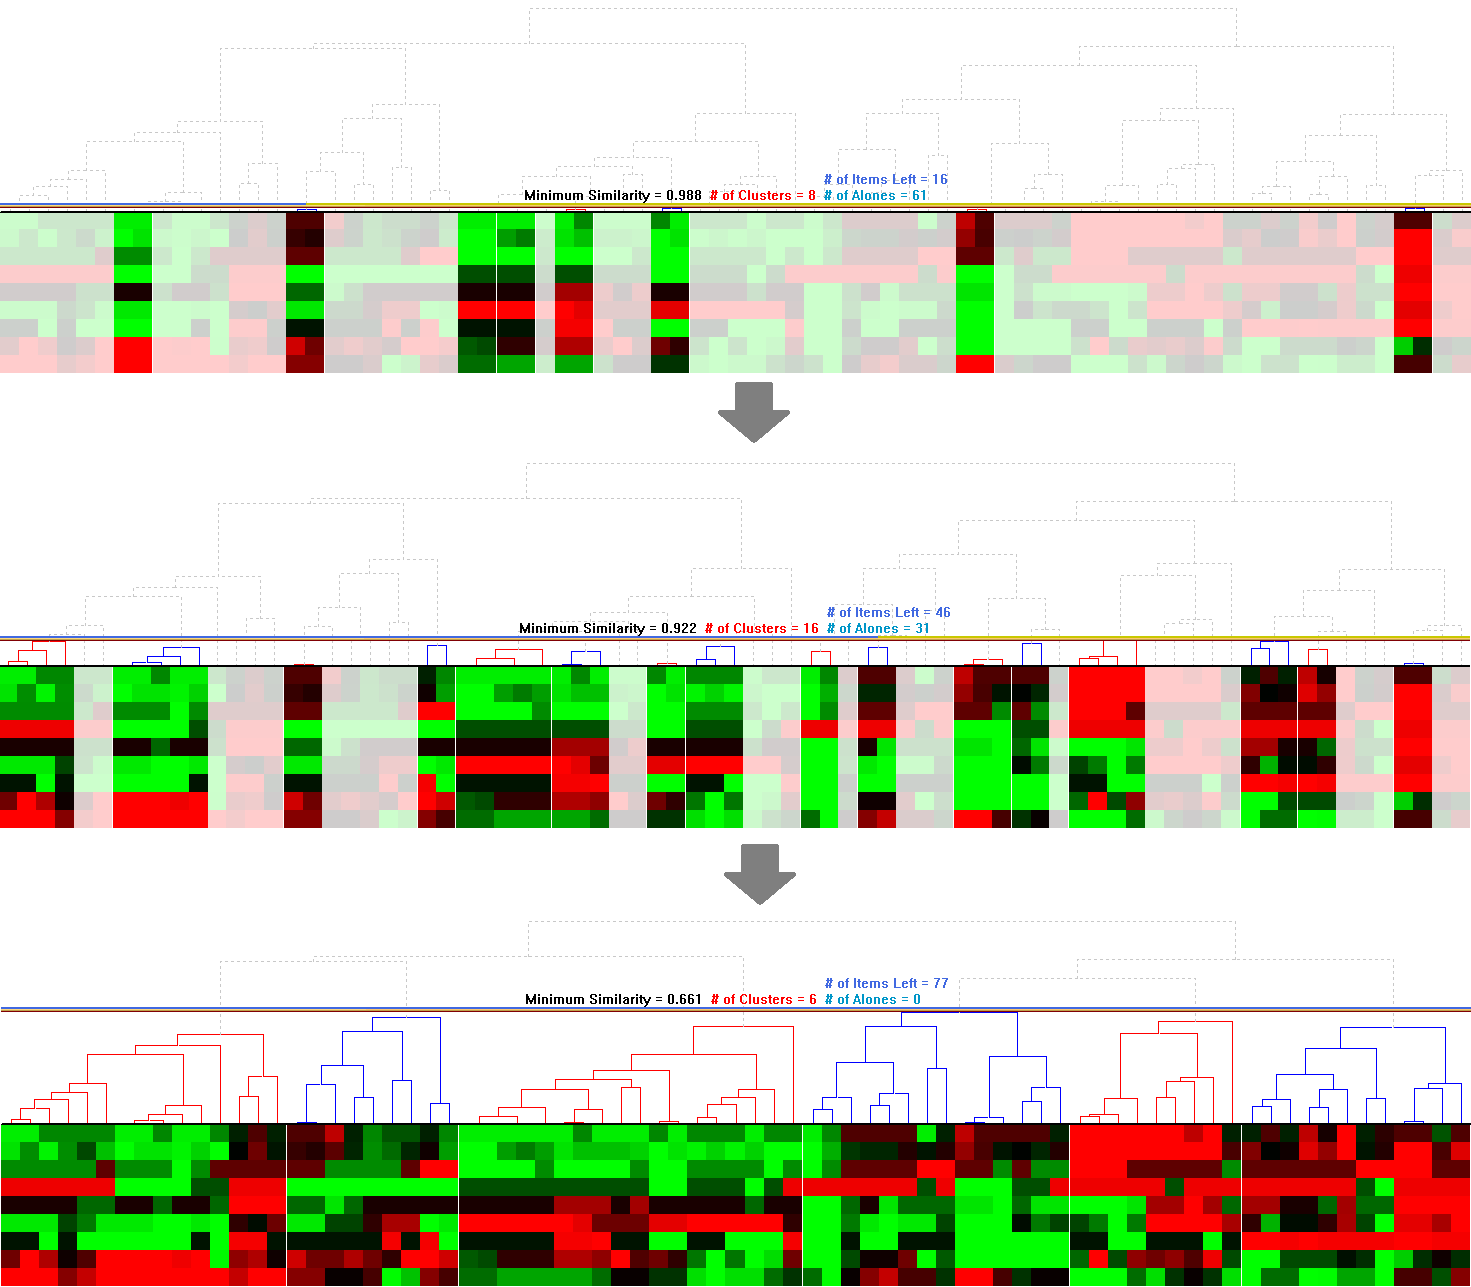
While HCE was designed to help users to better understand their hierarchical clustering results, it is interesting to note that they can gain better understanding of how the clustering algorithm works. It was surprising to know that a professor at a business school (Robert H. Smith School of Business, University of Maryland) used HCE to teach how the hierarchical agglomerative clustering works. Students could learn how the algorithm merges smaller clusters to make bigger ones by gradually dragging up the minimum similarity bar.
 |  |
Analyzing Personal Email Archives
HCE also helped users gain insights into meaningful temporal patterns hidden in a large personal email archive. Multiple-view coordination between dendrogram view and profile search view plays an important role when users try to figure out why a group of emails are clustered together.
 | article |
Uncovering Patterns in Aerosol Measurements Dataset
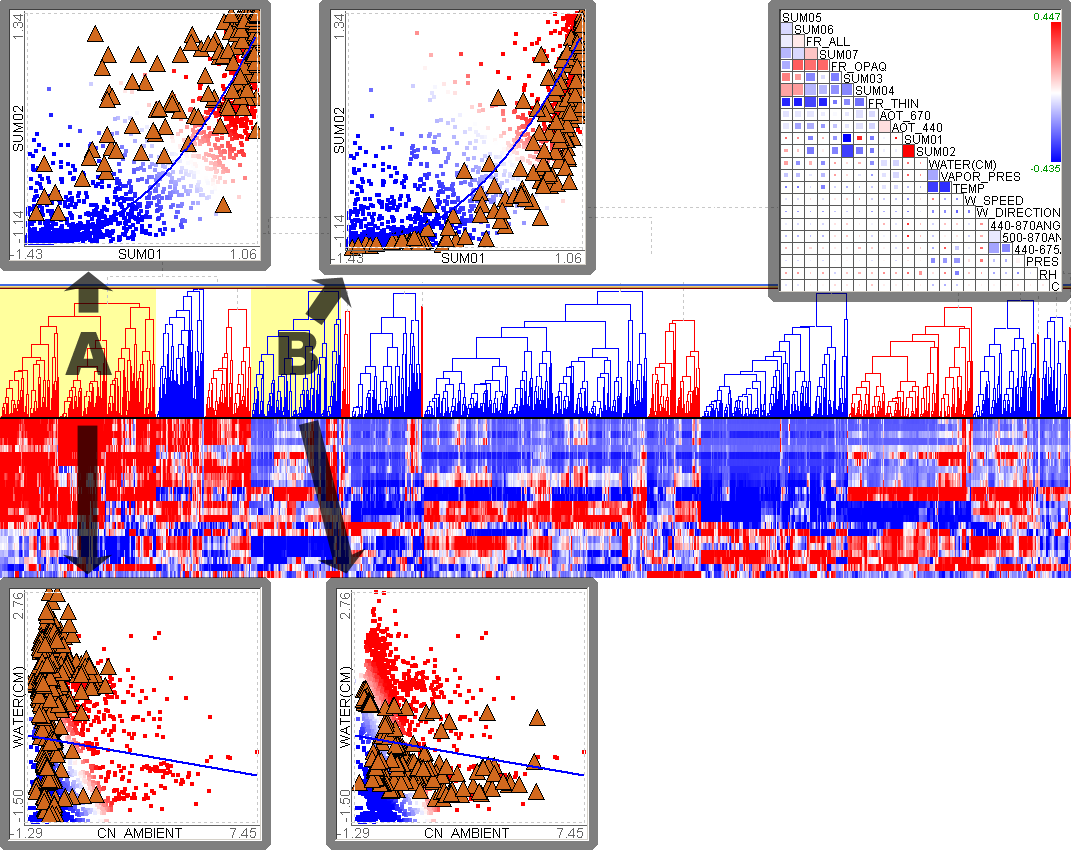
A meteorologist at University of Maryland wanted to explore his large multidimensional dataset of aerosols to figure out a good way to classify them according to their characteristics. After playing with the minimum similarity bar, he turned to the rank-by-feature framework to find out a couple of interesting quadratic or linear relationships between variables (or dimensions). He then started selecting clusters in the dendrogram view to check whether they strengthen or break down the relationship. He actually identified a couple of interesting aerosol clusters that might be useful to improve the underlying model regarding the relationship between aerosol concentration and the amount of water vapor.
 |
Links
Copyright of article and images belongs to the author or his employer unless otherwise mentioned