Making Hurricane Track Data Accessible
| Aidan Slingsby | City University London |
| Jane Strachan | University of Reading |
| Pier-Luigi Vidale | University of Reading |
| Jason Dykes | City University London |
| Jo Wood | City University London |
Published: October, 2010
 |  | Full article |
Context
The authors are a team of climate scientists from the National Centre for Atmospheric Science (University of Reading) and information visualisers at the giCentre (City University London). Through the Willis Research Network we worked in close collaboration to develop an exploratory analysis tool for the exploratory analysis of thousands of simulated storm tracks generated through multi-century global climate simulations. We use this tool to help validate the model, generate research questions and disseminate this knowledge to peers and the insurance industry who are interested in the financial impacts of atmospheric risk and impact of climate change on this.
Generating knowledge from this database is challenging. The simulated storm track data are global in coverage and span hundreds of years at multiple atmospheric levels. Yet individual events are a few hundred kilometres in size, short-lived and move rapidly, requiring a temporal granularity of a few hours. Wind speed, mean sea level pressure and storm rotation (vorticity) are provided at track points spaced at six-hourly intervals.
Users' requirements changed over the development period. They initially required means of exporting storms track animations as examples for dissemination. However, as the tool was being developed, exploratory research potential was quickly recognised by the climate scientists. We consider this as the main impact of the tool (see "impacts" section).
The tool
Our interactive tool (see our video clip) allows the exploration, validation and presentation of hundreds of years of dynamically simulated storm tracks. It consists of a zoomable world map, upon which storm tracks are displayed within an adjustable temporal window, animated though time. Tracks' thicknesses indicate windspeed and these fade over time. The zoomable map and ability to vary the speed of temporal animation track, allowed behaviour at key times and in key locations to be studied and captured. Tracks can be quickly scanned through by moving the mouse left/right, and interesting/anomalous track configurations can be identified. The temporal window can be varied to study patterns at different temporal scales from days to decades. The important characteristics of windspeed, vorticity and mean sea surface pressure can be queried at any position along the track. At any time, track formation and evolution can be captured as a video clip animation. The tool reads the data in the model's standard export format.
Impact
We consider the main impact of this work to be that the climate scientists in our team now recognise the value of interactive exploratory visualisation and have adopted the techniques. Contrary to existing approaches used by climate scientists for analysing datasets, the tool enables exploration of the formation and evolution of tracks without the need to impose a priori assumptions on the dataset. Existing techniques and tools available to the modellers require hypotheses to be formed and data to be prepared. This time-consuming process is not conducive to exploratory data analysis and hinders discovery of the unexpected. The climate modellers in our team found that these standard scientific tools became more efficient and effective when used in conjunction with interactive exploratory visualisation.
Impact on model validation
Studying the tracks over different timescales enabled both expected, unexpected and interesting patterns to be observed.
Increasing the temporal window over an entire season, enabled the expected patterns of El Nino and La Nina to be observed, demonstrating that the model is able to model these large-scale oscillations. The storm seasons started at different times in different years and this tool enables those years in which the season starts early and those where it start late to be identified. Subsequent analysis can be done to establish the atmospheric conditions under which this occurs.
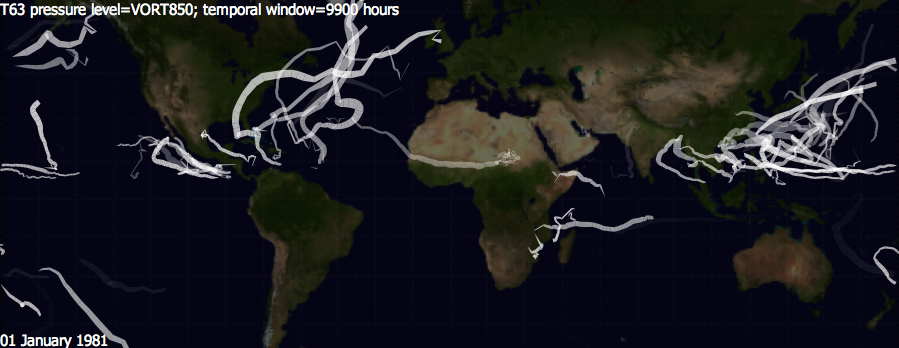 |  |
| El Nino (left) and La Nina (right) years showing expected patterns, but when comparing different years, it is clear that the storm seasons start at different times. The atmospheric conditions under which this occurs can be investigated further. | |
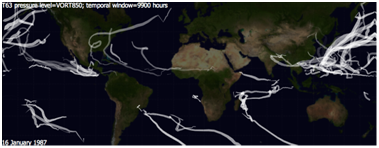
Numerous examples of "sticky tracks" were identified, where multiple storms follow similar paths within a narrow time period. The physics of this phenomenon are not fully understood - tropical storms tend to bring deeper, cooler water up to the surface through mixing this results in surface conditions that are not conducive to this phenomenon. The presence of these in the simulated storm set, suggested that this negative feedback does not always overcome prime local conditions.
 |
| Sticky tracks |
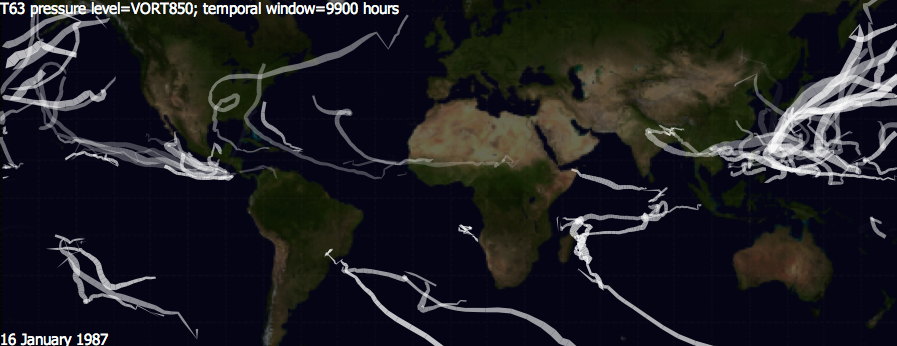
However, the tracks shown in the image below show strong similarities to this year's Atlantic Hurricane season, so much so that the climate modellers are comparing the conditions in the modelled year with those of this year. This is a good illustration of value of being able to quickly flick through many decades of storm tracks. This was not possible with the standard tools available.
 |
| This configuration looks very much like this year's Atlantic Hurricane season. |
Impact on dissemination of results
We regularly present our work to peers and audiences from insurance industry, and this tool enables us to identify specific examples that illustrate important storm behaviour. The illustration of particular behaviours with real examples, makes the information more tangible and engaging.
Examples can be produced by exporting video clips and the simple and uncluttered nature of the tool's interface makes it suitable for use live demonstrations. Our video was exported directly from the tool (with the addition of voiceover).
Impact on insurance industry
The insurance industry is interested in how risk may change with climate change. Simulating tracks over several centuries gives a better representation of the impact of natural climate variability on storm activity, than the use of historical records that are typically only a few decades long.
Tracks that cluster in time and space are usually more devastating than if separate events, yet this phenomenon well-known to climate science is often ignored in the insurance industry. Through exploratory analysis, we can demonstrate this phenomenon and communicate it to the industry.
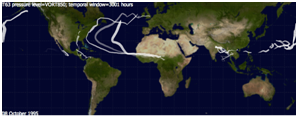
Another useful insight to convey to the industry is that many storms at high latitudes actually have tropical origins, as shown in the image below. Traditional insurance risk management treats tropical and extratropical storms as different types of event. If a single storm can manifest itself as both a tropical and extratropical storm, the overall impact is likely to be significantly worse than if separate events, because both impacts will be within a short space of time.
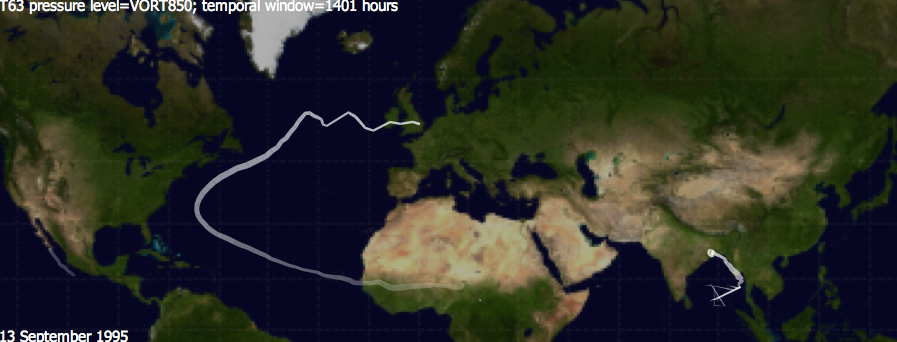 |
| Many storms at high latitudes have tropical origins. |
Links
Copyright of article and images belongs to the author or his employer unless otherwise mentioned