Tableau and Boeing: Visualizing Bird Strike Risk
| Andrew Wade | Simon Fraser University |
| Roger Nicholson | The Boeing Company |
Published: October, 2010
 |  | Full article |
Summary of the Tool
Tableau is a commercially available tool that allows users a large degree of interaction with visualizations of their data. It is well suited for visualizing categorical and numerical data, such as that of the FAA’s National Wildlife Strike Database, a database containing information on individual bird and wildlife strikes to aircraft.
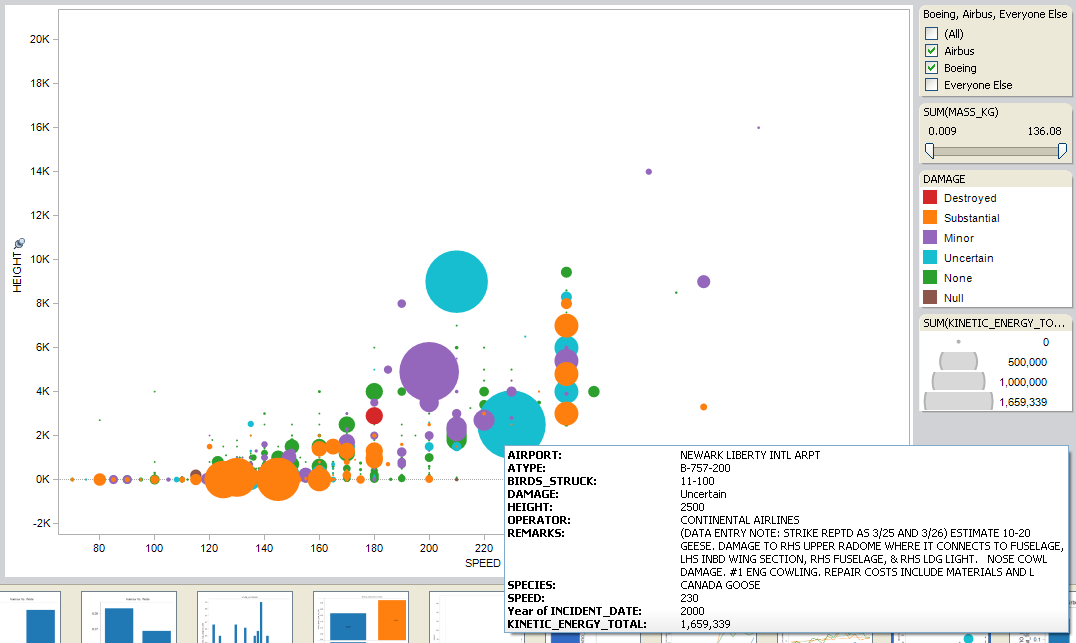 |
| Kinetic Energy in the Flight Envelope - Colored by Damage |
Summary of its Impact:
Analyzing Kinetic Energy of Bird Strikes
Bird strikes to commercial aircraft pose both a financial and safety risk. Safety engineers at Boeing are interested in ways to minimize both. This often involves understanding the most damaging strikes. Anytime an object collides with another object, there is kinetic energy. It follows that this is true when birds strike aircraft. Visualizing the kinetic energy involved in bird strikes using Tableau allowed Boeing safety engineers to locate damaging strikes to specific areas on the aircraft quickly and effectively, and determine where in the air they were occurring. This visualization was and is still being adjusted to analyze strikes to specific areas on the plane. Plotting kinetic energy in the flight envelope (Height vs. Speed) was a novel approach that is now being applied to non-birdstrike incidents.
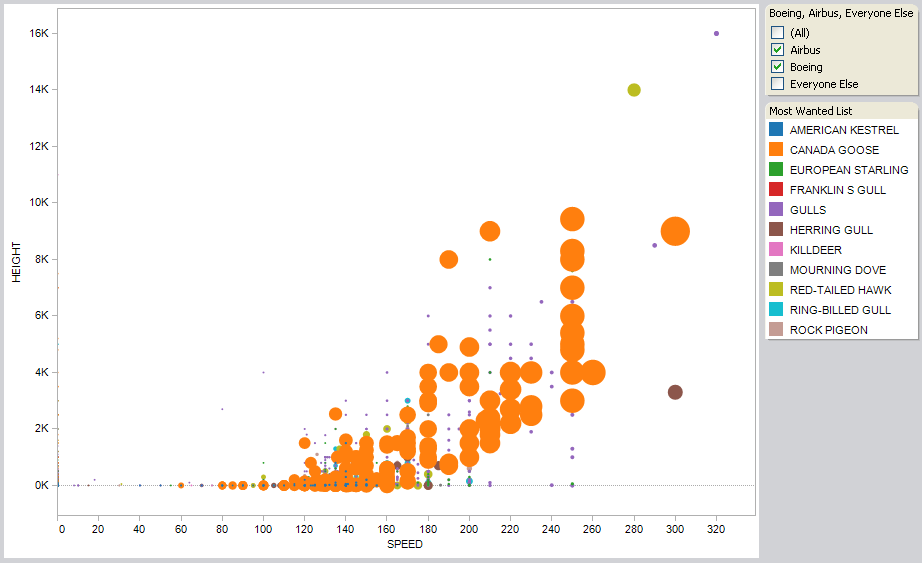 |
| Kinetic Energy in the Flight Envelope - Colored by Species |
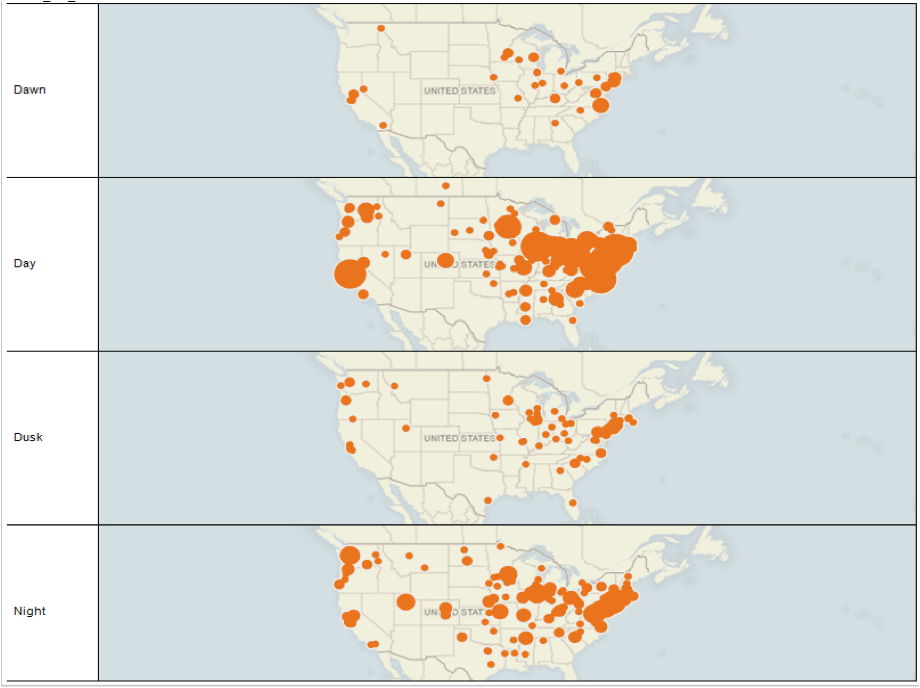
Understanding When Bird Strikes Occur
An important piece of the puzzle for minimizing the risk of birds striking planes involves understanding when the majority of strikes are occurring. Using a visualization of strikes by both month and time of day, Boeing safety engineers were able to suggest changes to flight training manuals, making flight crews more aware of the risk. Again, because of the interactivity of the tool, this visualization continues to be used to examine specific airports and regions and make recommendations for mitigation.
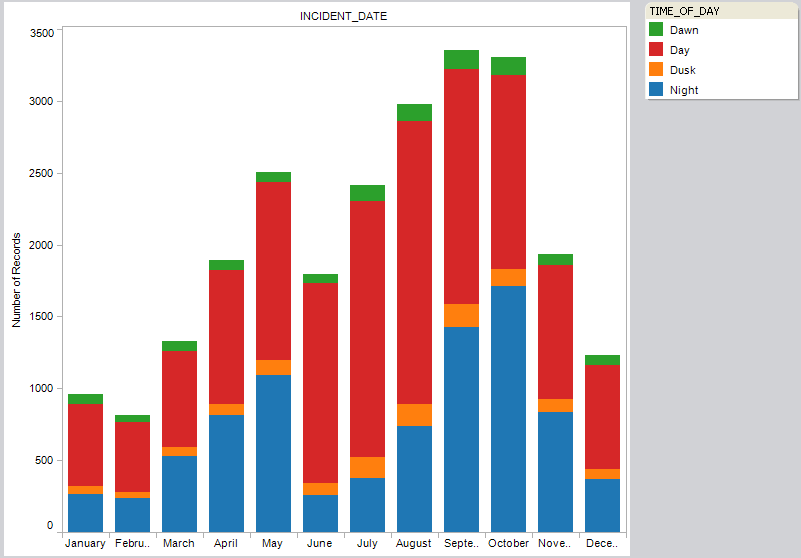 |
| Month and Time of Day of Strikes |
Presentation of Data
Once deemed a ‘safety issue’ by Boeing safety engineers, a risk will be dealt with accordingly. However, elevating potential risks to ‘safety issue’ status requires justification and evidence. While spreadsheets and statistics serve their purpose and are often necessary, an easy-to-understand visualization is much more powerful. Visualizing aspects of bird strikes to commercial aircraft provided Boeing safety engineers with an effective means of communicating risk to those who ultimately decide what to do about it. The exposure to capabilities provided by visual analytics tools such as Tableau has fundamentally changed the way safety engineers think about both analyzing and presenting data.
 |
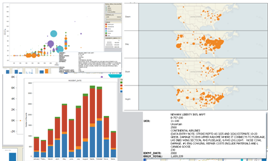
| Geographical Location and Canada Goose Strike Frequency |
Links
Copyright of article and images belongs to the author or his employer unless otherwise mentioned